DATE 2017: Some Personal Highlights

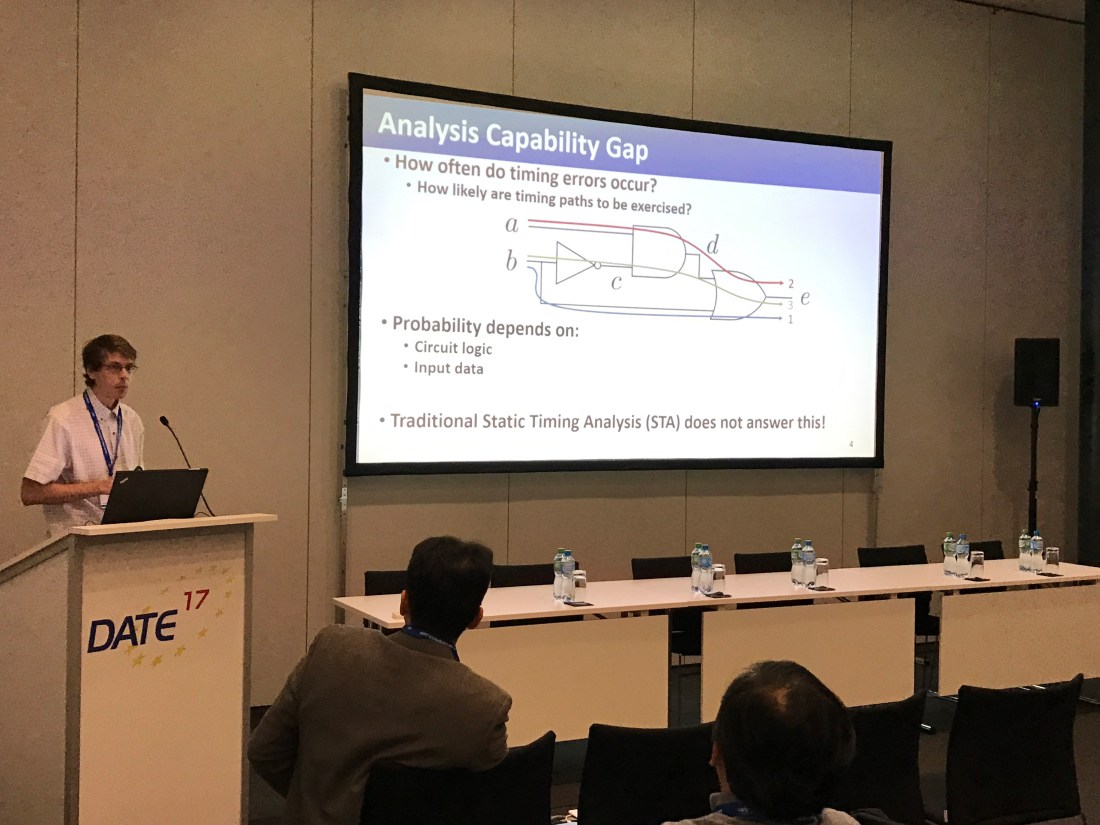
This week I was away at the 2017 Design, Automation and Test in Europe Conference (DATE) in Lausanne, Switzerland, where my collaborator and former staff member Kevin Murray was presenting our joint work with Andrea Suardi and Vaughn Betz.

IMG_9542

In this blog post I note a couple of personal highlights from the conference.

Apart from Kevin’s paper, which I describe in accessible form in a previous blog post, Jie Han and Marc Riedel‘s tutorial on stochastic computation was thought provoking. It’s an old idea, which I’ve seen a few times, but it was interesting to catch up with the recent thinking in this area: results on synthesis using Bernstein polynomials and a de-randomisation of the logic.

The theme of approximate computing pervaded the conference. Newcastle had an interesting paper on approximate multiplication where multiple partial products are compressed by replacing (implicit) summation with Boolean or operations. This complements more traditional approaches like I’ve worked on, where we just throw away partial products. It seems like there could be a few interesting generalisations of this approach.

It was also, of course, great to see the many colleagues I often meet at these conferences, and to spend some time in the laboratory of Paolo Ienne and meeting his PhD student Lana Josipovic, who is doing some very interesting work on high-level synthesis.

EPFL also has possibly the best underpass in the world:

DATE remains one of the best conferences to catch up with the various diverse directions in which EDA researchers have gone in recent years.

Overclocking For Fun and Profit

This week at the Design, Automation and Test in Europe (DATE) conference, Kevin Murray is presenting some exciting work I’ve done in collaboration with Kevin, his supervisor Vaughn Betz at the University of Toronto, and Andrea Suardi at Imperial College.

I’ve been working for a while on the idea that one form of approximate computing derives from circuit overclocking. The idea is that if you overclock a circuit then this may induce some error. However the error may be small or rare, despite a very significant performance enhancement. We’ve shown, for example, that such tradeoffs make sense for image processing hardware and – excitingly – that the tradeoffs themselves can be improved by adopting “overclocking-friendly” number representations.

In the work I’ve done on this topic to date, the intuition that a given circuit is “overclocking friendly” for a certain set of input data has been a human one. In this latest paper we move to an automated approach.

Once we accept the possibility of overclocking, our circuit timing analysis has to totally change – we can’t any longer be content with bounding the worst-case delay of a circuit, because we’re aiming to violate this worst case by design. What we’re really after is a histogram of timing critical paths – allowing us to answer questions like “what’s the chance that we’ll see a critical path longer than this in any given clock period?” Different input values and different switching activities give rise to the sensitization of different paths, leading to different timing on each clock cycle.

This paper’s fundamental contribution is to show that the #SAT probem can be efficiently used to quantify these probabilities, giving rise to the first method for determining at synthesis time the affinity of a given circuit to approximation-by-overclocking.

Playing with L-Systems

For today’s session of the math circle I jointly run for 5-7 year-olds, we got the kids to play with Lindenmayer Systems (L-Systems for short). L-Systems can be used as compact representations of complex geometric shapes, including fractals. The aim of the session was for children to understand that simple formulae can describe complex geometric objects, building on the intuition that properties of shapes can be described algebraically that we got through a previous session on symmetry and algebra.

I stumbled across this excellent L-System generator on the web, which was perfect for our needs as we didn’t need to install any software on the school laptops. After illustrating how the Koch Snowflake could be generated, we simply let them loose to experiment, suggesting that each time they set the number of iterations to 1 before exploring a greater depth of iteration. They seemed to really enjoy it. On a one-to-one basis, we discussed the reason that various formulae generated their corresponding shapes, trying to embed the link between the equations and the graphical representation, but the main emphasis was generating visually pleasing images.

Here are some of the curves they produced. In each case, the caption is of the form: number of iterations, angle, axiom, production rule.

I would have liked to have the time to discuss in more depth why the curve that appeared to fill the triangle had no white space visible.

Once we had finished, we finally drew together where I presented a simple L-System for the Sierpinski Triangle, an object they’d seen before in a previous session. There were several exclamations of awe, which are always great to hear!